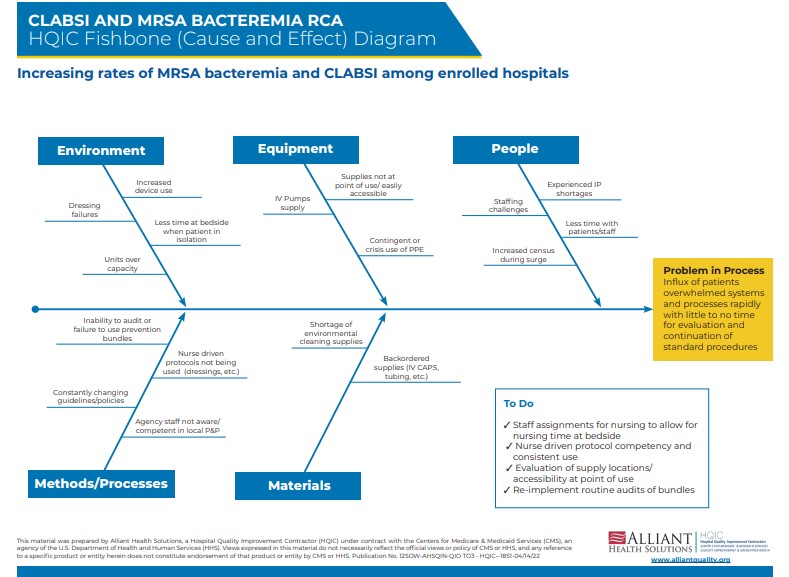
A fishbone diagram (cause and effect) is a visualization tool for categorizing the potential causes of a problem or effect. Each cause or reason is a source of variation. Causes are usually grouped into major categories to identify and classify these sources of variation. Select the top three causes for the team to focus their performance improvement efforts.
Intended Audience
HQIC
Provided by
Alliant HQIC
Last Updated:
July 18, 2023